
Google Analytics is a must-have for any and every website on the internet.
It’s a completely free, incredibly useful tool that first and foremost tells you how much traffic you’re getting to your website, but then also offers in-depth insights into the behaviour of those users and how they interact with your pages.
There is a wealth of invaluable data to be viewed in Google Analytics that can be used to your marketing advantages, from finding out where your website traffic is coming from right down to what content performs the best and everything in between.
While the mass amounts of data displayed in GA may seem overwhelming, once you know where you need to look and what you’re looking at, it becomes one of the most powerful and easy-to-use tools you’ll ever have in front of you.
Here’s our handy guide to analysing your website traffic in Google Analytics.
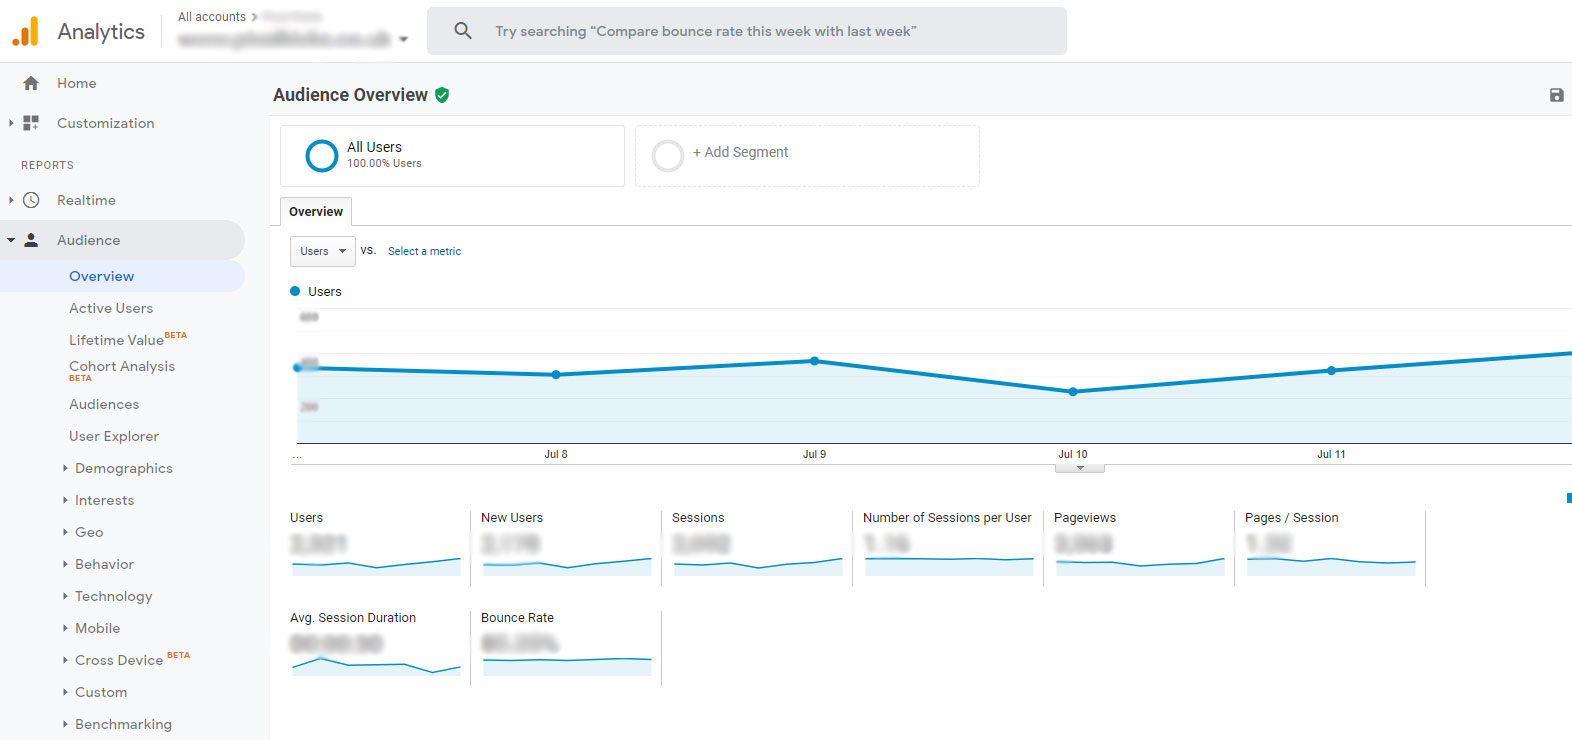
Audience
This is the key part of Google Analytics for getting a proper understanding of the type of users your website is attracting. This information can provide you with important insights that can be used to determine different aspects of your marketing and site optimisation.
The audience section of Analytics breaks down your data into multiple sets, each showing you different aspects of your website’s audience.
Demographics
The information presented in the demographics section can be crucial for some companies, and can help shape the future direction of your marketing strategy.
Age and gender data is presented to website owners, showing them how many sessions and individual users fit into the multiple age brackets or genders. This data can be converted into percentages using the ‘Demographics Overview’ tab, with clear visual data creating an easy way of comparing your data.
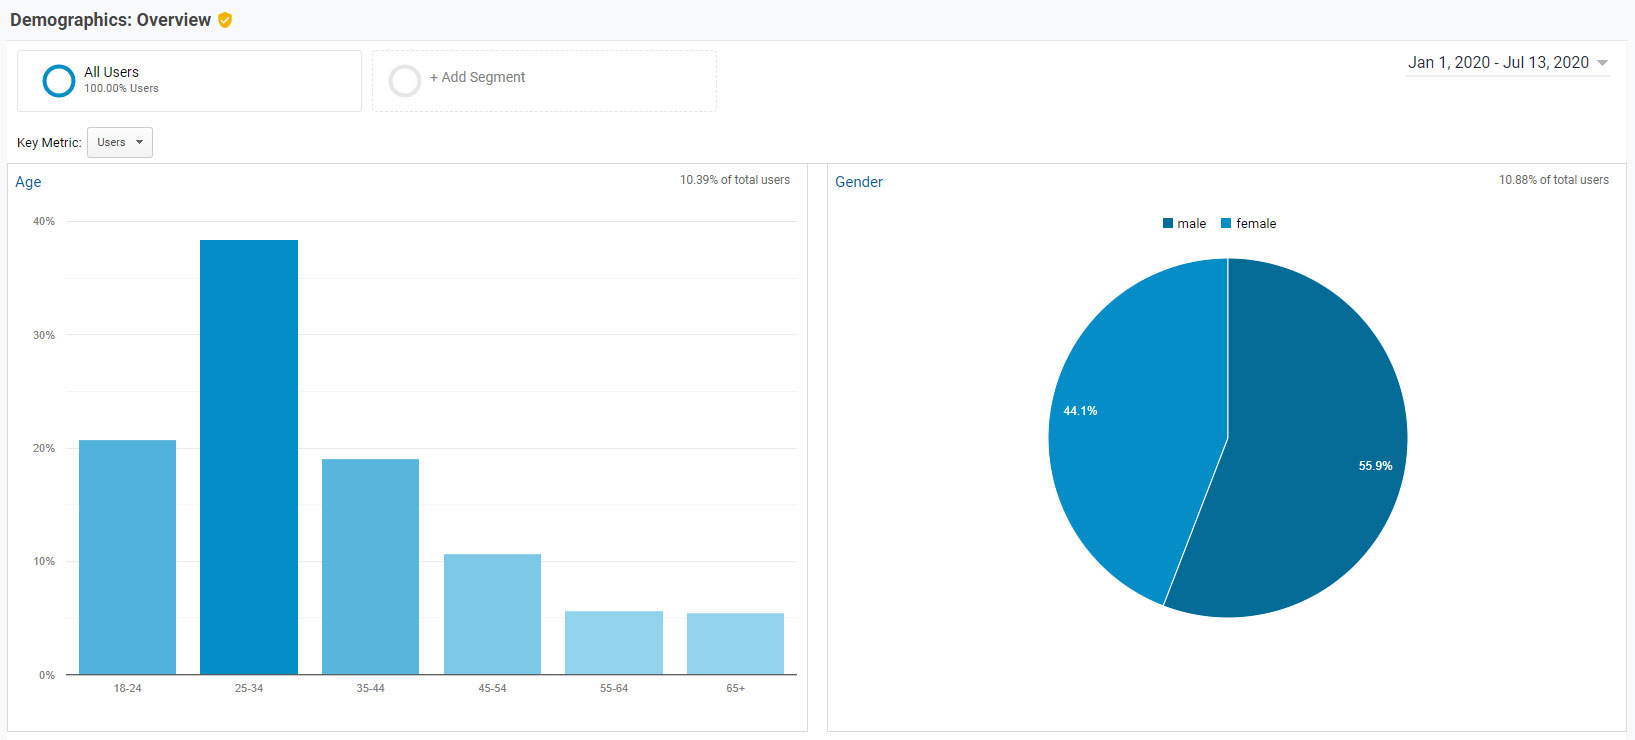
This information is typically pulled from the Google account your site users are logged into, as well as other third party sites or cookies.
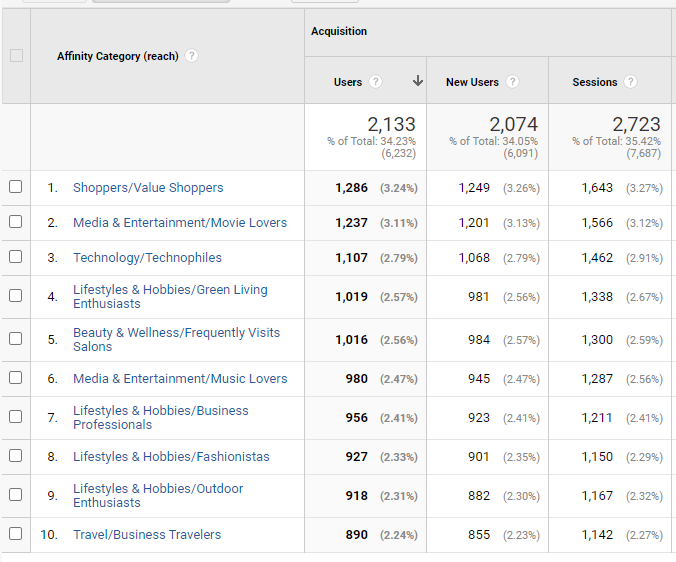
Interests
Google’s tracking cookies can build up a wealth of information about users over time, all of which can prove very valuable when it comes to marketing.
The interests section of Analytics is split into three subsections. The first is ‘Affinity Categories’, which is based on the search and website browsing history of your users. If users regularly visit a certain category of website, they may fit into an “affinity” category, which can be used to give you an idea of their interests and behaviour. Examples of affinity categories include value shoppers, business professionals, and music lovers.
The second subsection is “in-market segments”. This information is created when users search for products or services, and is often used as a targeting method in Google PPC campaigns. These segments show you that your site visitors are in the market for things such as business software or marketing services.
The third subsection is “other categories”, which includes things such as a user’s key life events, such as “recently started a business”, or “moving house soon”.
Devices
It’s important to find out how people use your website, and this information is spread out over two key categories.
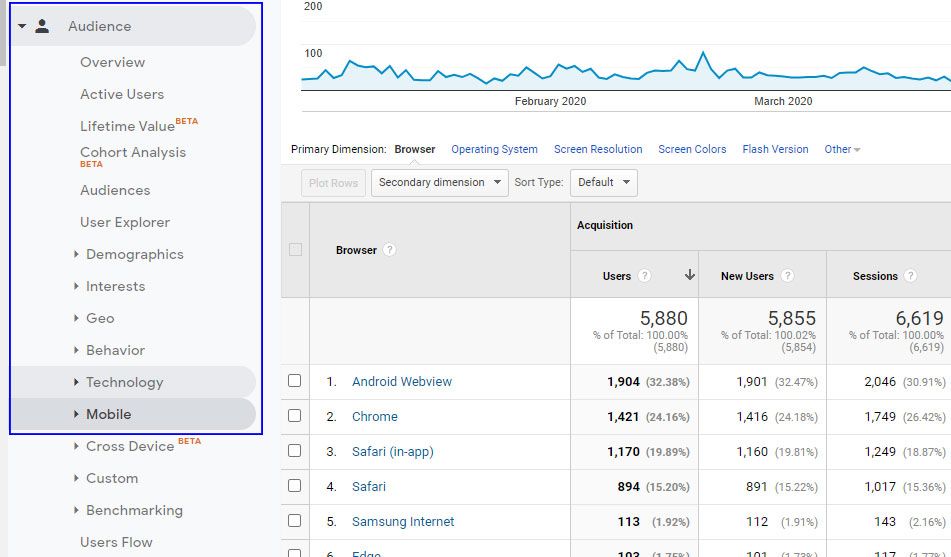
‘Technology’ is the first category, detailing as much information as possible about the devices people use to visit your website, such as the operating system of their device, their web browser, and screen resolution.
The second category is ‘Mobile’, something which should definitely be focused on thanks to the large-scale shift from desktop to mobile browsing over the last decade. This section will compare the number of users and sessions to come from desktop, mobile and tablet devices, while breaking the data down further to tell you the specific model of phone they’ve used.
Geo
As the name suggests, this section is all about the geography of your website’s users, with the data split into two sets.
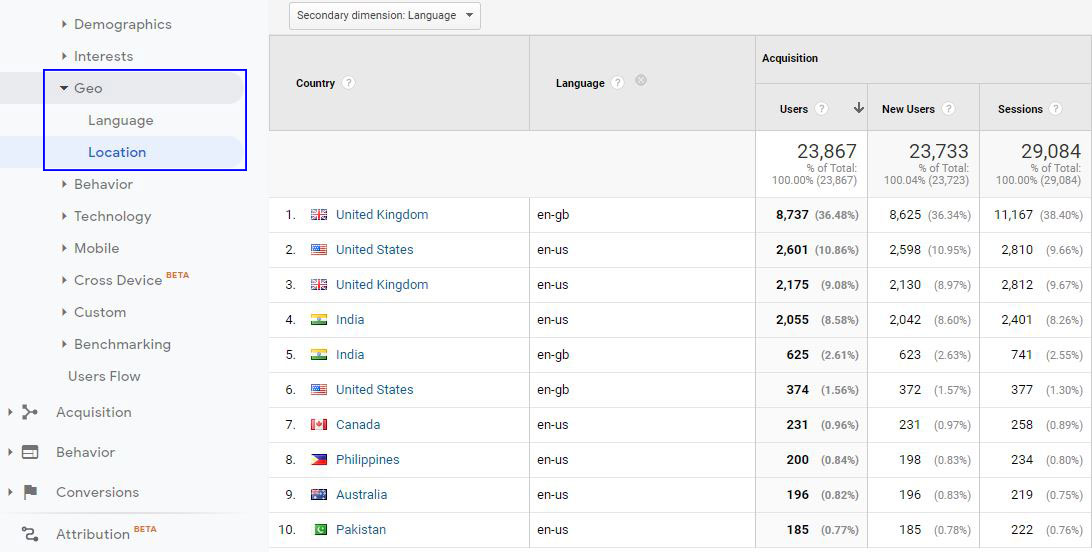
The first set is language, which allows you to see the default language your users’ browsers are set to use. This can be a useful stat, as you may notice a large portion of foreign language users using your website, something which may inspire you to add multilingual options to your content.
The second set is location – initially, this will show you the countries your site has been visited in, but you can either narrow or broaden your view, with options to see cities, continents, and sub-continents too.
Behaviour
Not to be confused with the main “Behaviour” section of Analytics, this is a smaller section within the audience tab.
Here, you can find useful stats about the behaviour of your site users, with three different options available.
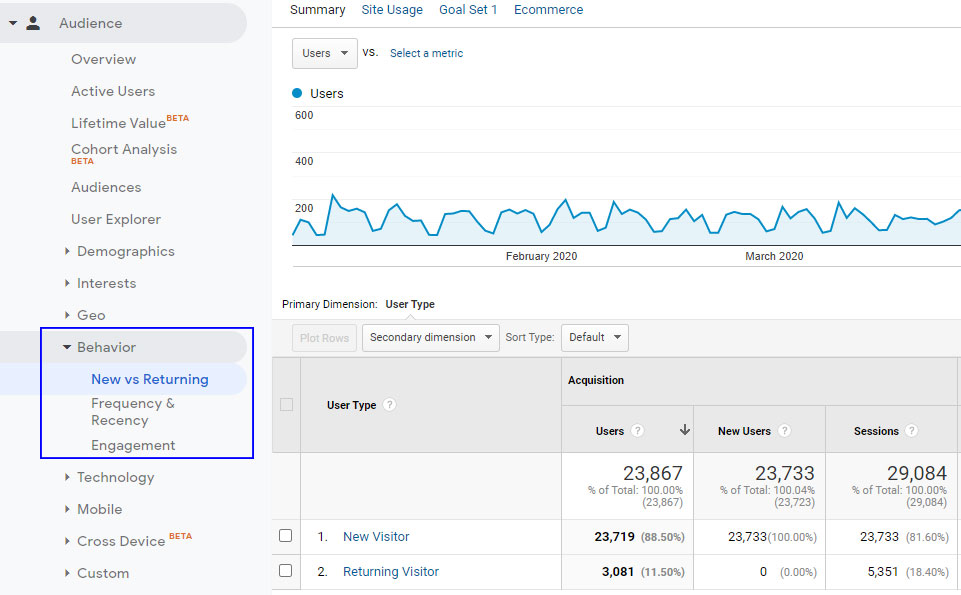
The first is ‘New vs Returning’, which compares users who have visited your website before, to those clicking onto your site for the very first time.
The second option is ‘Frequency & Recency’, which gives you a closer look at your returning visitors. ‘Frequency’ allows you to see how many times users have visited your website in individual sessions, while ‘Recency’ shows how many days it has been since your users’ last sessions.
The third and final option is ‘Engagement’, which breaks your site sessions down into different brackets of time. It means you can see the number of sessions that lasted between 0-10 seconds, 11-30 seconds, 31-60 seconds, and so on.
Acquisition
The Acquisition report in Google Analytics is an incredibly important and useful feature that tells you exactly where your website traffic is coming from.
With this data, you can view in plain sight which of your marketing efforts are the most effective, and then make informed decisions about where you should be spending your time and money to capitalise on this to really drive more traffic and sales.
Overview
The Acquisition Overview tab offers a full summary of the top channels sending traffic to your website. Typically, you’ll be able to see the amount of visitors that have landed on your website through Organic Search, Direct, Referral and Social. Should you also be running paid ads, you’ll be able to view how many users have been pulled in from Paid Search and Display ads.
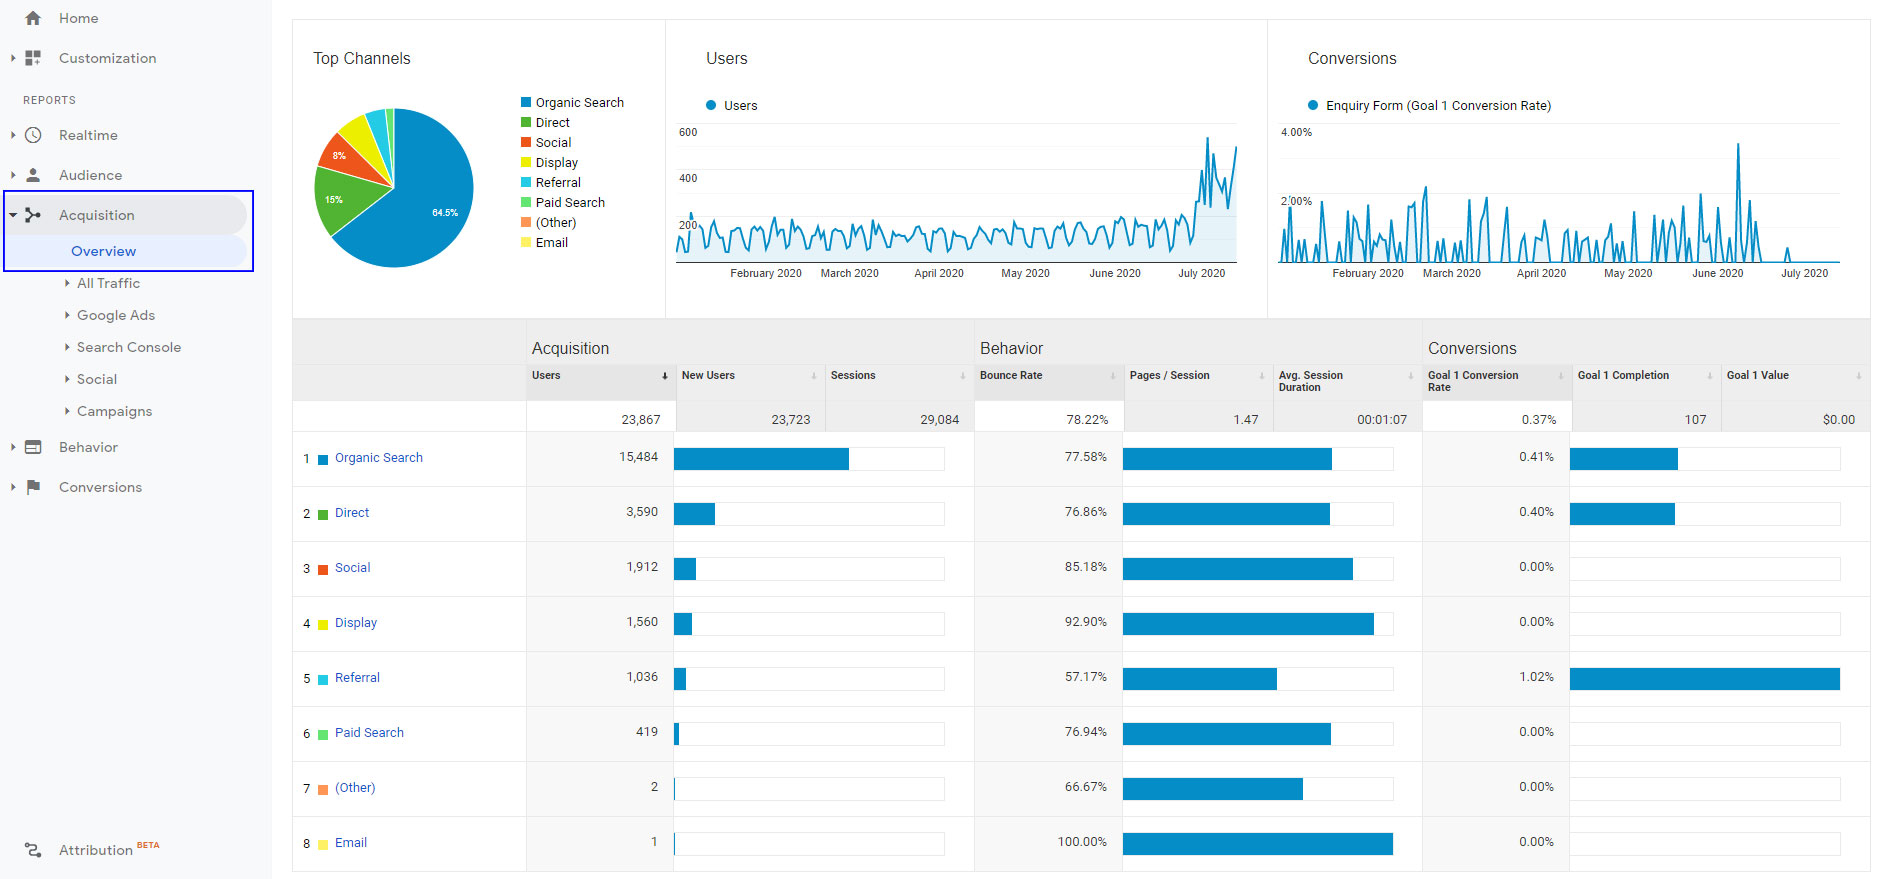
The overview report also goes into detail on the Acquisition-Behaviour-Conversion (ABC) cycle. This very handy chart shows from which channel your website is pulling in traffic, their behaviour on your website and how many followed through with a conversion (if you have conversion tracking set up).
Channels
You can find the Channels report under ‘All Traffic’ in the acquisitions tab. This report details which channels your users are arriving from, and their journey through the ABC cycle.
Fully understanding and analysing the Channels segment of Google Analytics is key when it comes to knowing which channels perform the best for you, and where you’re generating the most conversions from.
The most common Google Analytics Acquisition channels explained:
- Organic Search – These are visitors coming to your website from a search engine such as Google, Yahoo and Bing. This means that your website appears organically in search results for the terms that were searched for, and are not paid ads. By clicking into this metric on the report you can see which search terms brought visitors to your site.
- Direct – Visitors who have visited your site directly, usually by typing your URL in.
- Social – This is traffic that has been generated through any social platform such as Facebook, Twitter and Linkedin. You can find more details on which platform brought in the most traffic by clicking into this section.
- Referral – Visits from external websites which refer traffic to you via a link.
- Email – These are counted when a user clicks through to your website from a link in an email.
- Paid Search – Any visits that have been generated through your pay-per-click campaigns on search engines such as Google Ads or Bing Ads.
Source/Medium
Before diving straight into the Source/Medium tab, it’s important to know the difference between the two. A source is the specific place that the visitor arrived from i.e. a search engine like Google or a social platform such as Facebook. The medium details how the user got from A to B, i.e. by clicking a referral link or a paid ad.
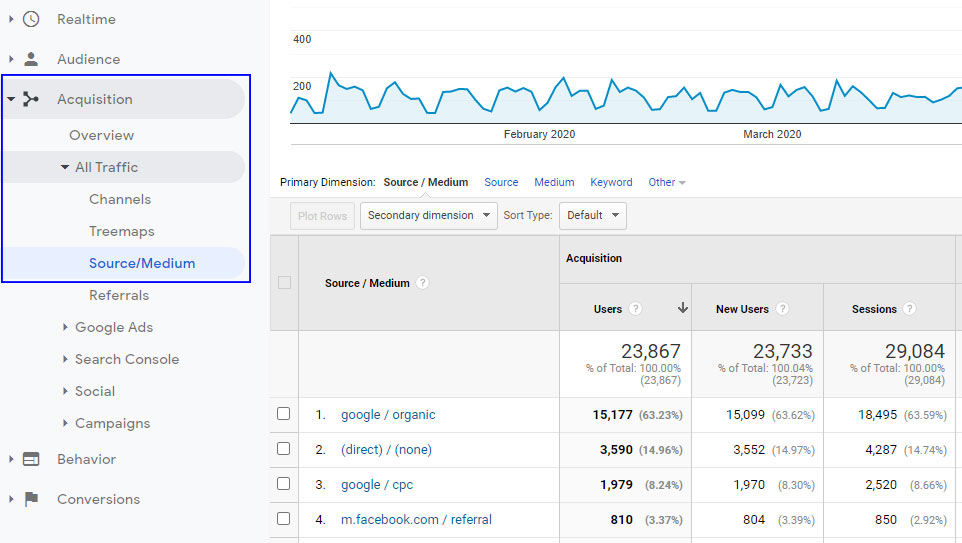
This section of Google Analytics lets you quickly analyse where the majority of your traffic is coming from, and the method on each platform which is proving most effective. This is a great way to determine how your marketing efforts are working out – for example, if your Google PPC is worth the money or if your organic rankings are proving to be most successful on their own without the monetary spend.
Referrals
The referrals report in the Acquisition section allows you to see what kind of traffic you’re getting from referrals alone. This is particularly important if you’ve invested heavily in driving traffic to your website from other websites.
If generating backlinks has been a key part of your marketing strategy, here you’ll be able to see the amount of traffic that is being referred from those linking websites. You’ll then be able to check out the ABC cycle detailing how those visitors are interacting with your website, and whether or not your strategy has been effective.
Social
Social media is an incredibly powerful marketing tool for businesses of all sizes. As with any other marketing efforts, measuring your social media success is highly important when it comes to assessing the effectiveness of your strategies.
The Social report in Google Analytics is a great tool to see what works and what doesn’t, and which social media platforms are helping to achieve your goals.
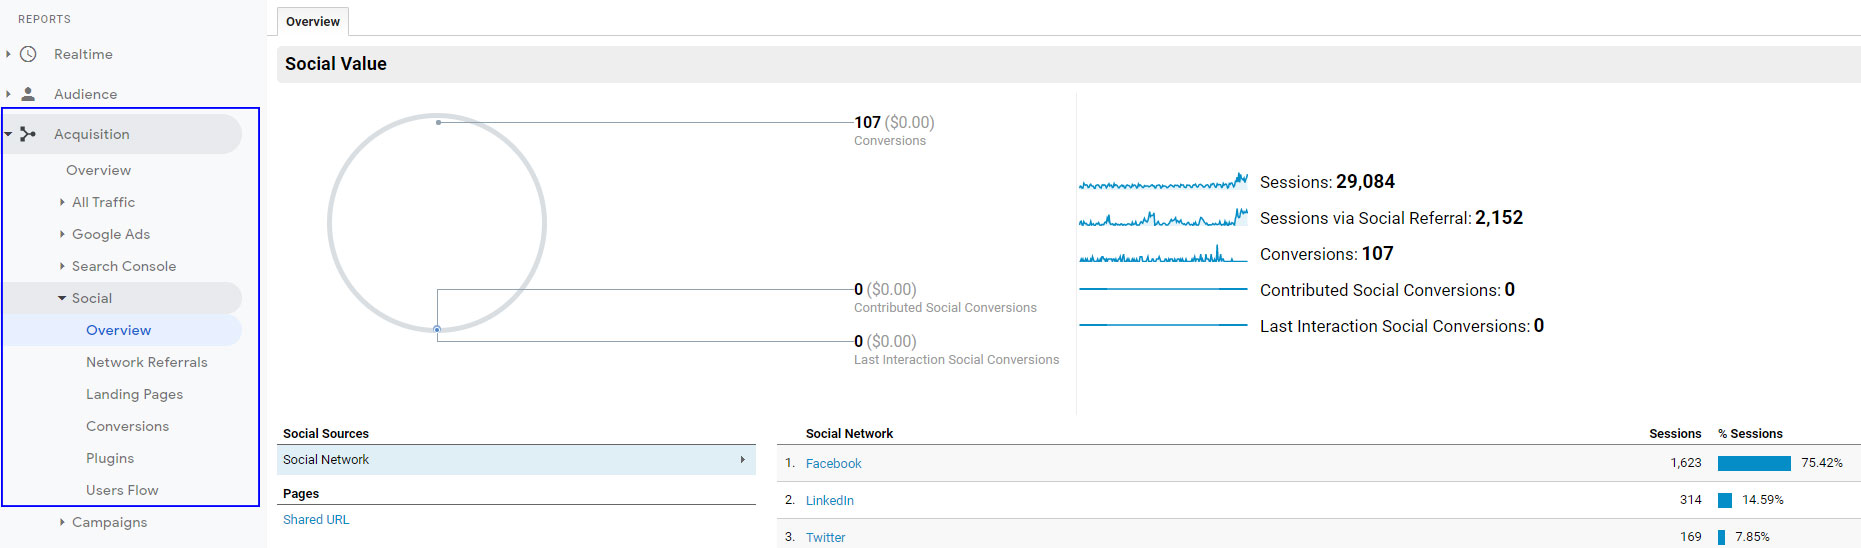
There are a number of different things that we can look at in this report to gauge a clear idea of how your social posts are influencing your traffic:
- Social Overview – Here you can see a breakdown of which social channels are generating traffic to your website, and calculations on how many conversions you have had via social media.
- Network Referrals – This is a more detailed view showing the amount of traffic being directed from social media and users’ behaviour on the website.
- Landing Pages – This gives an insight into which social media content is performing the best, and the pages on your website which have been visited as a result.
- Conversion – If you have conversion tracking set up, this is where you’ll be able to measure the value of your investment in social media content as monetary value through conversions.
Google Search Console
If we’re talking about breaking down and understanding our web traffic, then Google Search Console has to enter the conversation.
Known until 2015 as Google Webmaster Tools, Google Search Console is the search giant’s platform that allows search markets to check the indexing status of their website, and use that information to optimise for increased search engine visibility.
We know that we can use Google Analytics to break down our traffic by source and medium, but here we have an opportunity to scrutinise our Google traffic in some serious detail.
Using Google Search Console to understand your Google traffic
In order to use this feature, your GSC account must be connected to your GA account. Head to the Search Console tab under Acquisition to get deeper insights into your traffic.
Select a date range, and enjoy interacting with your Google traffic in the following ways.
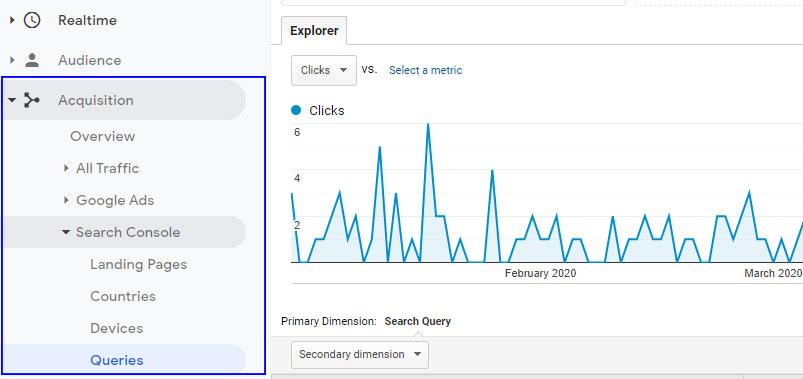
Queries
The Queries report lists the Google Search queries that generated clicks and impressions for the website URLs that are ranking in Google. So here, you can understand what sorts of Google searches are bringing people into your website.
This is extremely valuable information for both content marketing and keyword research.
Pages
The Pages report lists the website pages that generated clicks and impressions on Google. With this report you can understand which pages are bringing people into your website.
You can use this information to determine what your key landing pages are at that moment in time, and decide where you need to focus your time and resources.
Countries
The Countries report lists the countries that generated clicks and impressions on Google.
Running an international website? With this report you can gain sense of which countries are engaging with your website the most.
Devices
The Devices report allows lists the devices (desktop, tablet, or mobile) that deliver the best search performance and user engagement.
All of this combines to give us an in-depth understanding of how our website is performing on Google. Sound interesting? You can learn how to get set up on Google Search Console by reading their information resource here.
Google Ads
An article on understanding your traffic sources wouldn’t be complete without touching on the contributions your PPC campaign makes. Luckily for us users, linking a Google Ads and Google Analytics account couldn’t be easier.
Linking Google Ads to Google Analytics
There are a few steps to linking your two Google accounts, but before doing so it is important to ensure that the Google account you are signed into has the necessary permissions in both Analytics and Ads.
1. Sign in to your Google Ads account manager
2. Click on the “Tools & Settings” icon and then under “Setup” click on “Linked Accounts”
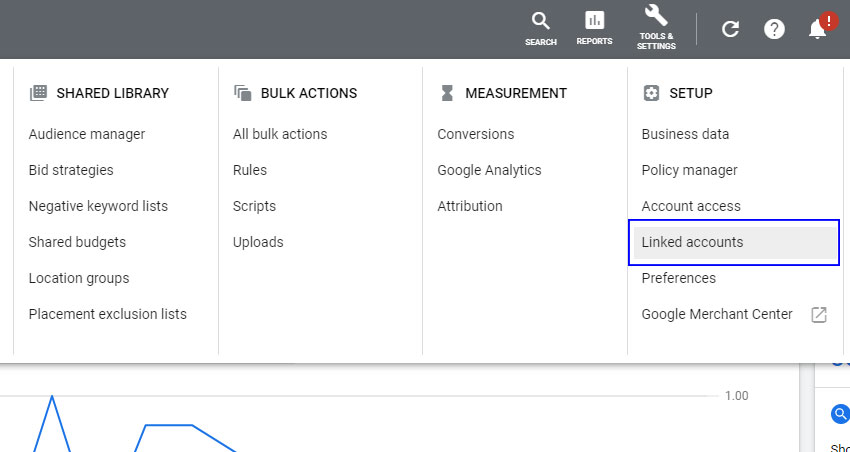
3. Navigate to Google Analytics and click “Details”
4. Select the Google Analytics account you desire from your list of permitted accounts
5. Select “Link”
6. Hit save
Now that you have linked your Analytics and Ads accounts you should start to see a flow of data in both directions, for now though let’s just look at how this affects Google Analytics.
Clicks & Users
As this article is focused on measuring the traffic coming in to your website, the metrics you need to be aware of boils down to clicks and users. If you would like to read more in depth about the remaining metrics associated with PPC campaigns then you might like to read our blog on the subject here.
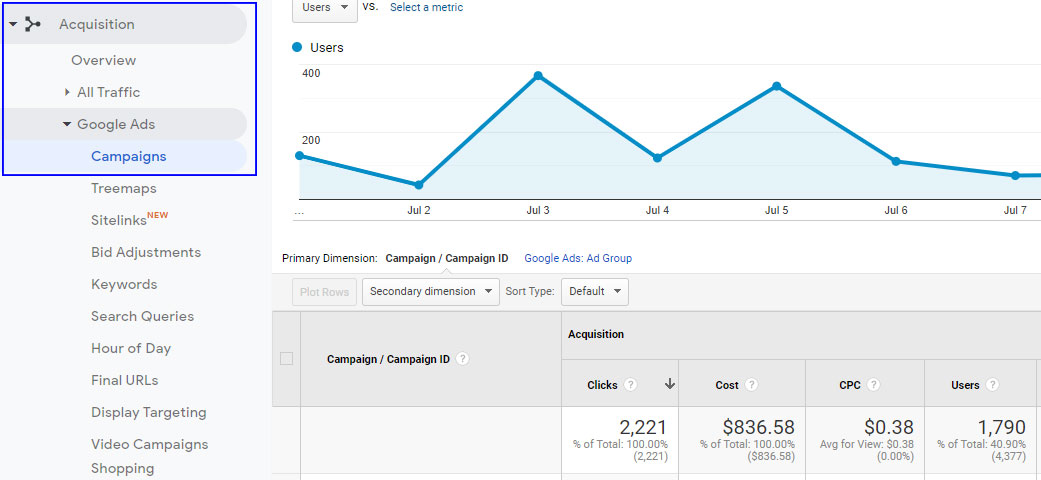
Clicks are an important metric to measure as it shows the number of times that users have clicked through to your site and with which search terms. This gives you several key pieces of information; what people are interested in, and how many people are returning users.
Take for example a web design campaign that has received 150 clicks. From the clicks metric you can assume that 150 of your sessions have come from the PPC campaign, and from people interested in web design. This can be compared to the click metrics of other campaigns to determine which topic your audience is more interested in.
Following this, you should now be looking at the Users column to determine how many of those sessions were unique. In the web design campaign let’s say we had 80 users; what this tells us is that over half of the 150 clicks were not unique. This is not necessarily a bad thing as it shows that your customers are returning to your site and therefore will likely be trying to learn more about your services or considering making a purchase.
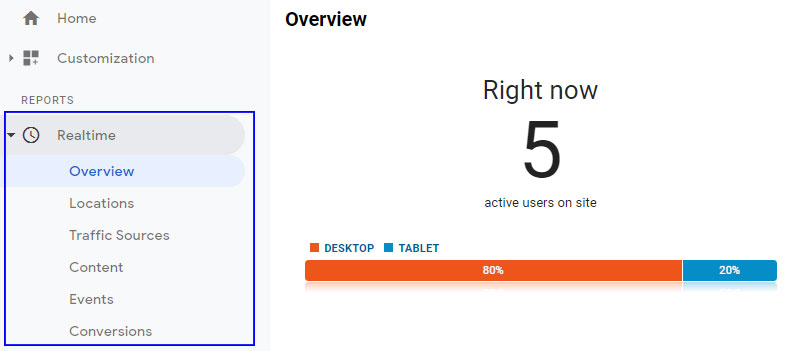
Real-Time Reports
Google Analytics’s Real-Time reports section gives you the ability to monitor activity on your website as it happens. For a better understanding of our web traffic we can use Real-Time for the following insight.
This can be particularly useful when launching a marketing campaign with a temporary nature. Say for example you’re looking to gauge reaction to a tweet you’ve just posted, or an email blast you’ve just sent, then it can be really handy to see how traffic shapes up in real-time.
In Real-Time Reports you’ll find:
Locations
The Locations report tells us which countries our active users have come from. There’s even an interactive heat map that you can use to visualise the data, along with the standard list format. Filtering your traffic by country can be particularly important for high traffic websites with international objectives.
Traffic Sources
The Traffic Source report tells us where our visitors have come from. The data is nicely delivered into mediums and sources.
You’ll want to visit this report when new campaigns have gone live, or you’ve just been mentioned in the press. You’ll be able to see, in real time, the effects that this campaign is having.
Content
The Content report tells us which pages our current visitors are interacting with, so we can understand how traffic is moving around the site in real-time.
You can toggle this report so that it displays data over the past thirty minutes.
Events and Conversions
In the Events and Conversions reports we can look at how many times a specific event or conversion was completed across the past thirty minutes.
Being able to monitor campaigns as they unfold is a powerful addition to Google Analytics and it has given us digital marketers a valuable play-by-play insight into how our traffic is interacting with our websites.
If you want to start using Google Analytics to track your website more consistently, then why not get in touch with a team that knows their SEO? Please get in touch with us today to see how we can help.
MORE LIKE THIS
VIEW ALLWhat do Swiss mountains and project management have in common?
11th February 2025

Building an Accessible Website: Essential Practices for Developers
12th December 2024

What is content pruning in SEO and why should you do it?
14th October 2024

Osteo to SEO: My Journey from Physio to Digital Marketing
4th September 2024