
Social media marketing is one of the major ways to boost your online profile as a business, and reach a wider audience.
If you’re not already using social platforms as part of your digital marketing strategy, you should be. As of January 2020 there are 3.8 billion social media users worldwide, making utilising these platforms a no-brainer for businesses, when it comes to getting your content in front of a wider audience.
While having a strong social media presence is essential, due to constant updates in algorithms on these networks, it’s become a necessity for businesses to start investing some cash into their social accounts.
For online businesses trying to succeed, simply relying on organic posts won’t drive the results you’re looking for. When spending time creating great content, naturally you want people to see it but unfortunately, this reach is limited without paid social.

Boosted posts, sponsored ads and action driven campaigns all offer direct routes to getting your page and posts in front of the right people, at the right time.
However, as with any other method of marketing, it’s important to track the success of your social media campaigns. In order to determine what’s working and what’s not, you need to be keeping track of performance and staying up to date with new features and algorithm changes so you can adjust your strategies accordingly.
It’s crucial to be measuring the most important social media advertising metrics, but what exactly are those? In this blog, we’ll look further into what you need to be tracking dependent on your campaign objectives, and the tools do this on each network.
Key metrics to track in social media campaigns
Ready? Here goes.
Engagement
Measuring how your audience are interacting with your content and social pages is a huge indicator of how effective your posts are, and whether or not people find them interesting or useful.
Engagement comes in many different forms. Likes, comments, shares, retweets, link clicks and so on, they all essentially show how your posts are performing.
Driving high engagement rates shows that you’re targeting the right people with the right content, and is great for analysing not only the interest of your audience, but how many of your followers are real, genuine people.
What are the key engagement metrics, and what do they mean?
- Likes, comments, shares etc – These are all individual engagement metrics which are a direct indicator of how effective your content is. For users to want to spend the time engaging with your posts, it means that they are genuinely interested in what you have to say and, in the case of shares, believe that it is worthy enough to be seen by other people too.
- Link clicks – If your campaign involves sharing links to blogs or pages on your website, it’s good to keep track of how many people are actually clicking through to read more. This way, you’ll know if you’ve been targeting the right audience with content that peaks their interests, and whether or not you should continue to post similar.
- Followers – Particularly important if you’ve launched something along the lines of a Facebook ‘page likes’ campaign, and noticed an increase in likes/followers. We’ll discuss follower count in more depth later on.
For ease of keeping track of your campaign’s engagement, look at the overall engagement rate which takes all metrics into account, divided by the number of impressions (people who have seen the posts).
A sudden drop in your engagement rates per posts or profile may be a red flag that you need to analyse your recent content or your target audience.
Follower Growth
One very easy but very important metric to track is Follower Growth. Something many large accounts are led astray by is having a consistent growth in followers. Let’s say you run an account that has been steadily growing and is now at around 2000 followers. For the last year you have received a steady 50 followers per month and have a consistent engagement rate. Sounds good right? Well, not exactly. What many accounts don’t realise is that as your account grows steadily, your growth rate will fall. This is something that becomes more important over time, and so it is important to start tracking early.
To understand this more, let’s first look at how to calculate your growth rate. The formula is simple:
No. of new followers this month ÷ No. of followers at the start of the month X 100 = Growth Rate
So for an account with 2000 followers at the start of the month, gaining 50 new followers will give a growth rate of 2.5%, remember that number for later! Where accounts often go wrong is assuming that a consistent growth of 50 followers is a good thing, while their growth rate declines steadily stagnating their account.
Let’s look into this a little more:

As we can see, the account has grown from 1700 followers in May to 2050 in November. As we said before, starting the month off with 2000 followers and gaining 50 gives a growth rate of 2.5%. All very well and good. What the chart now shows us though is that this account’s growth rate has been dropping consistently, from 3% in May to 2.27% in April, and will be at 2% in the following July.
So why is this important? If you want to grow your account and keep track of how engaging your content is, it is important that you track your growth rate more than the growth itself. Doing so will ensure that your account doesn’t stagnate, and you will see your overall growth grow exponentially.
Account Reach
Another very important metric to measure is reach. Reach can be defined as the number of unique people who see your post, as opposed to impressions which is the total number of times your post was seen, regardless of engagements.
Why is reach important? Simply put, the higher your reach, the more people have seen your message, and are in a position to engage with it. If your campaign hinges around growing your followers, or spreading the word of a new product or service, then reach is vital.
Luckily, reach is also one of the simpler metrics to track, as most if not all major social media platforms have a built in method of viewing your reach. It can be viewed in the Facebook page/business manager and on the post insights in Instagram’s business account analytics tools.
Reach can also be useful to determine how engaging your posts are. If you observe your posts to have a high reach, but are only receiving minimal engagements in the form of likes and comments, then the content may have been spread far and wide thanks to the strength of your following, but the message it contains has fallen short of the mark. Conversely to this, you may find that one of your posts has an average reach, but very high impressions, meaning those who see your post are coming back to view it again, meaning the content was very successful.
Using Google Analytics
Some social media campaigns will be designed and optimised to generate web traffic to a specific landing page on a website. We discussed the value of landing page analysis in last month’s PPC metrics blog.
Here, social media marketers will take a key interest in just how much traffic they have been generating. Of course you can use each platform’s built-in analytics to track link clicks and so on, but the most powerful and accurate indication of success can be found through utilising Google Analytics’ traffic sources.
Acquisition / All Traffic > Source/Medium
Just to refresh your memory, a traffic source is simply where the web traffic has come from. There are many different potential sources of traffic across the internet, each website is a potential source if there is a link that can be clicked to take you from that to yours.
Each source can then be attributed to a medium, such as organic or referral.
So, here we have a breakdown of how many visitors have reached your site by clicking on the links that you have been posting out across social media. You can use this to compare and contrast the effectiveness of different social media channels, as well as any paid social content that you are running.
Tip: You can create your own Source and Medium by adding parameters to the links that you are using with your social media content. If you wanted to attribute your traffic to specific posts, you can use Google’s Campaign URL Builder to build these by simply inputting a Campaign Source, Medium and Name.
For further analysis, we can use Google Analytics’ Acquisition > Social reports tab. Here, the Social section gives us much more detail and depth in terms of the social activity surrounding a website. For example we are given a summary of conversions linked to social networks, provided we have these set up for the website.
Social consists of seven useful reports:
- Network Referrals, which shows you the top social networks that produce visitors for your website.
- Landing Pages, which shows you the the pages on your website that are receiving the most social traffic.
- Conversions, which measure the success and impact of your social campaigns by aligning them with your on-site goals.
- Plugins, which can show you which social buttons users have clicked on across your site.
- Users Flow, which shows you how users who reached your site from social media are interacting with your site.
Social Media ROI (Return on Investment)
Being able to measure social media ROI is essential to validating any budget work in and around your social marketing strategy. It gives you the ability to define what is working for you, and what isn’t; from here you are able to maneuver your financial resources around effectively and squeeze as much out of every cost per click.
Calculating Social Media ROI
What ROI means for your social media campaign will largely depend on the organisations of both the campaign, and the business that you are working for as this will determine what is perceived as valuable.
If you are selling products through social media advertising on Facebook, for example, then you would be able to calculate ROI by revenue using a simple formula such as:
Revenue / Investment (people hours, budget and so on) multiplied by 100.
Say if you made £1,000 in revenue from £500 worth of Instagram ads promoting a line of jeans. Your profit is £500 (as profit = revenue – investment). Your calculation would then be:
£500 profit / £500 investment multiplied by 100 = 100% return on your investment.
In Hootsuite’s great article on the most common ROI formulas this is discussed in far more detail, giving you different formulas for different campaign objectives.
The more performance related data we have available to us, the easier it is to test and optimise a variety of ad types before committing large budget portions to those that have proven themselves to be cost effective.

Social media influence
As social media marketers, we want to know who is talking about the brands we are looking after and what sorts of things they are saying.
Social media influence is a term used to describe the impact that a brand, or person (think influencer) has online. It can be used to quantify the waves that a business is making across social media, and to evaluate the public perception of brands when they are being discussed by social media users.
Unlike all of the other metrics in this article, influence doesn’t have a clearly agreed, quantifiable value. Different platforms, such as Upfluence, measure this differently to help marketers find relevant influencers. This is valuable in terms of ensuring that partnerships are struck with the right brand alignments.
Social media listening tools such as BuzzSumo have been developed for monitoring purposes. You’re able to track mentions, trends and updates surrounding a topic or business, keeping a finger on the pulse when managing social media accounts.
BuzzFeed used BuzzSumo to measure the buzz around the bog roll buyout https://t.co/DHQ9dldmGz
— BuzzSumo (@BuzzSumo) March 4, 2020
Measuring your success on each social media platform
Each social media network has different tools to effectively report on the success of your campaigns. They are free and easy to access within your account, and all hold valuable data while some metrics differ on each platform.
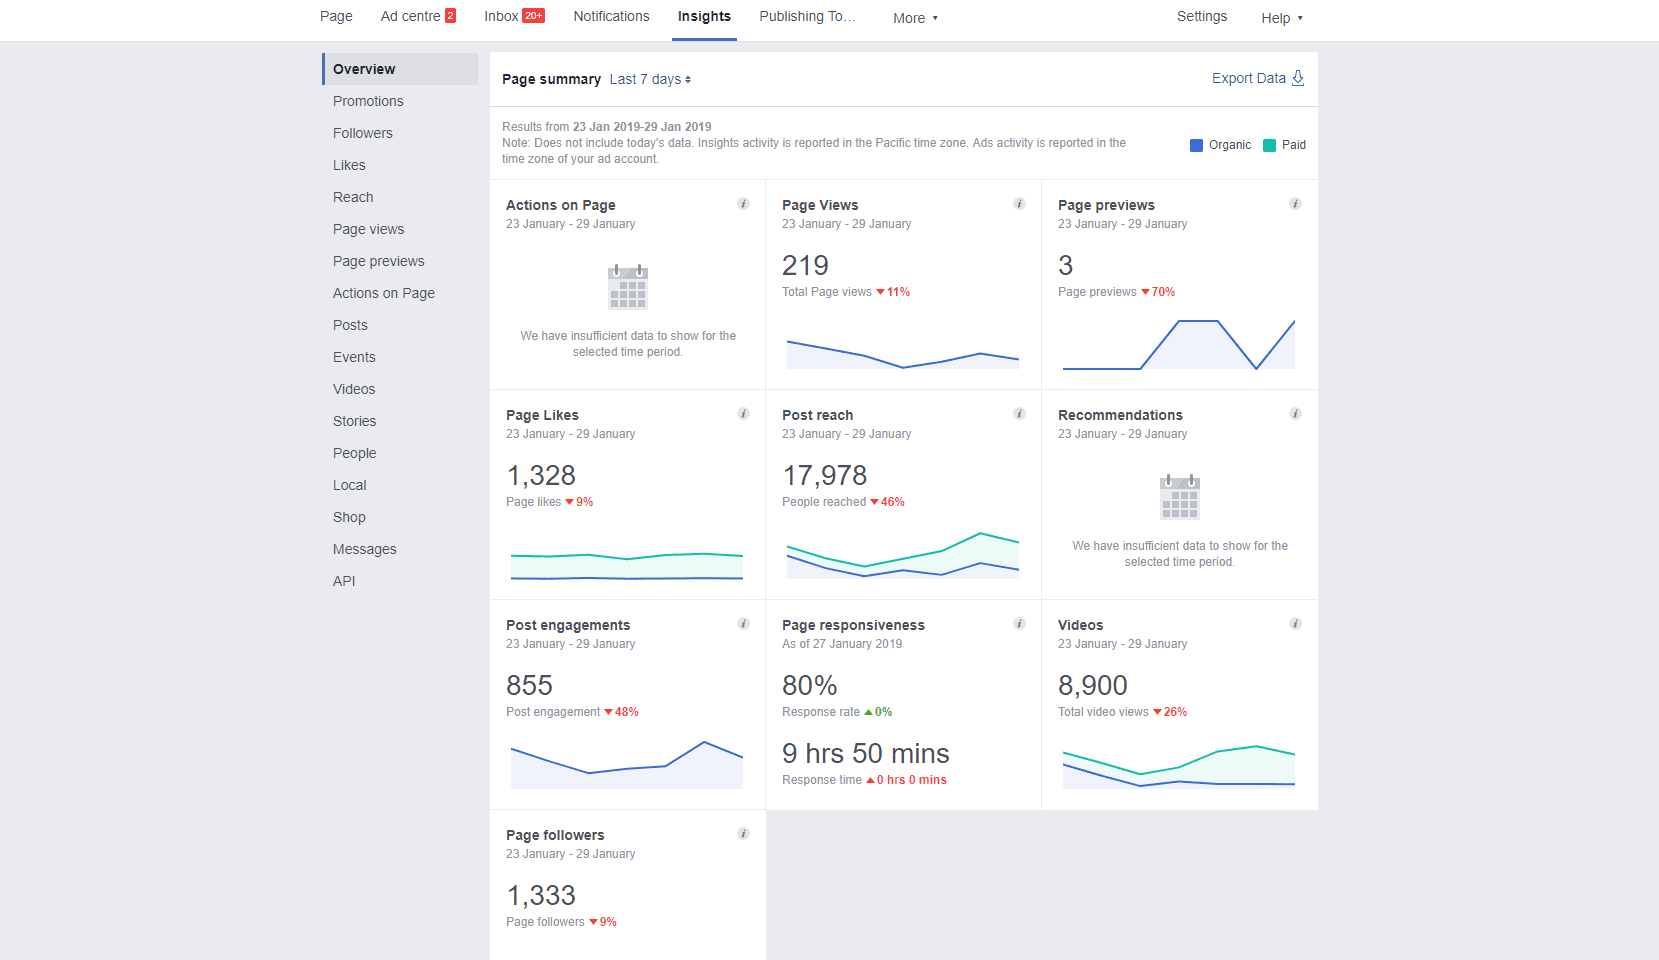
Facebook Insights is an analytics tool that offers in-depth information about your Facebook page and the content you post on it.
As well as an ‘overview’ section, featuring several key stats displayed over a chosen time period, there are detailed sections dedicated to key Facebook metrics, including:
Followers
In the follower section of Facebook Insights, you’ll find details about your page followers, including a look at how your follower count has changed over time, and where the page follows happened (such as on your page or on Facebook search results)
Likes
This section is mostly identical to the followers section, instead replacing the data with stats about your page likes.
Reach
Page reach is a hot topic when it comes to marketing – in the early days of Facebook, users would see every post a page they liked had made on their news feed, but with a focus now on paid advertising, it’s difficult to organically get posts out to a wide audience when not utilising a budget. The reach section of Insights is a great place to track this, with graphs of data showing how many organic and paid impressions your content has received over a given time period, and also showing you how many interactions such as likes and comments you receive on a daily basis.
Page views
Another important area, this shows you how many people have viewed your page during your selected time period, and breaks down the data into things such as demographic, and the source of the page view.
Actions on Page
This section tracks actions that don’t fit into the usual list of interactions (such as likes and comments), Instead, it tracks things such as the clicks your page’s action button, usually set-up with a call-to-action such as ‘Book Now’ or ‘Learn More’. It also tracks interactions with some of Facebook’s pre-set buttons that give people directions to your premises, send users to your website, or allow calls to your business number to be made.
Posts
While a lot of the above sections give you an overview of your Facebook page’s general performance, this part of Insights breaks down your data post by post. As well as showing reach and engagement figutres for each individual post, it also shows what times and days of the week have seen your posts get the most views, enabling you to better schedule content in future.
People
This section offers a useful insight into the gender, ages, and locations of people who are either counted as fans of your page, followers, or have viewed one of your posts.
The Twitter Ads campaign dashboard offers detailed reports into how well your ads have performed in terms of: Impressions, Engagements, Spend and Conversions.
These can be viewed through a custom date range, and easily segmented by:
All campaigns
For a full overview of your results and spend within a certain time frame.
Individual Tweets
For a detailed summary into the performance of one of your sponsored tweets.
Individual campaigns
To view the performance of any of your previous or ongoing campaigns.
Goals
To view the results of any specific campaign in terms of followers or link clicks, depending on your objectives.
Targeting criteria
For a breakdown of which of your target audiences are engaging the most with your ads.
Twitter Ads also allows you to look further into demographics, locations, platforms and easily set up conversion tracking to help in measuring your ROI.
https://www.youtube.com/watch?v=BosuL6TVtUg
If you run a business page or an advertising account on LinkedIn, you’ll have access to the business-based social media network’s analytics offering. When looking at how your business page is performing, your analytics are split into three main categories:
Visitors
This section details the traffic your LinkedIn business page received, showing you how many page views and unique visitors you get. From there, you can also use LinkedIn’s detailed CV information to see the type of user who has clicked onto your page, with information about their job function, seniority, company size and industry.
Updates
Here, you can see how your individual posts (updates) have performed, with information about impressions, link clicks, video views and other interactions. If you’re looking at gearing your content towards gaining more interaction, this is the place to start by researching what has so far performed the best.
Followers
With this section, you can monitor how your page’s growth is progressing, with an up-to-date graph showing your increases (and decreases) in follower count. As with the visitor section, you can also get an insight into job-based demographics and the locations of your followers. The followers section also allows you to compare your followers with those of similar companies such as competitors, with a list automatically generated by LinkedIn based on a number of criteria.
Looking to start a social media campaign of your own? We’d love to hear from you. Give us a call on 0161 713 1700 or send us a message via our enquiry form, and one of our team will be happy to discuss your project with you.